We all know the value of data. It’s been talked about ad nauseam for years. The data dialogue has now shifted to one around customer preference data, well because it just makes sense. Being able to go deeper into your audience to know their habits and preferences on how they like to use your services is brilliant. Given that, we’ve ensured that our dashboard provides metrics that give our customers ways to act on that data. This is one of the main things that geeks us out about our platform.
We’re able to see where consumers prefer to watch and record their content, which not only helps influence your marketing strategy but also who you should consider doing partnerships with in the future. Our first Quarterly Metric Report debuted in Q3 and the response was strong. Folks were really intrigued by the data set that we’re able to provide our customers, which is always an assuring thing.
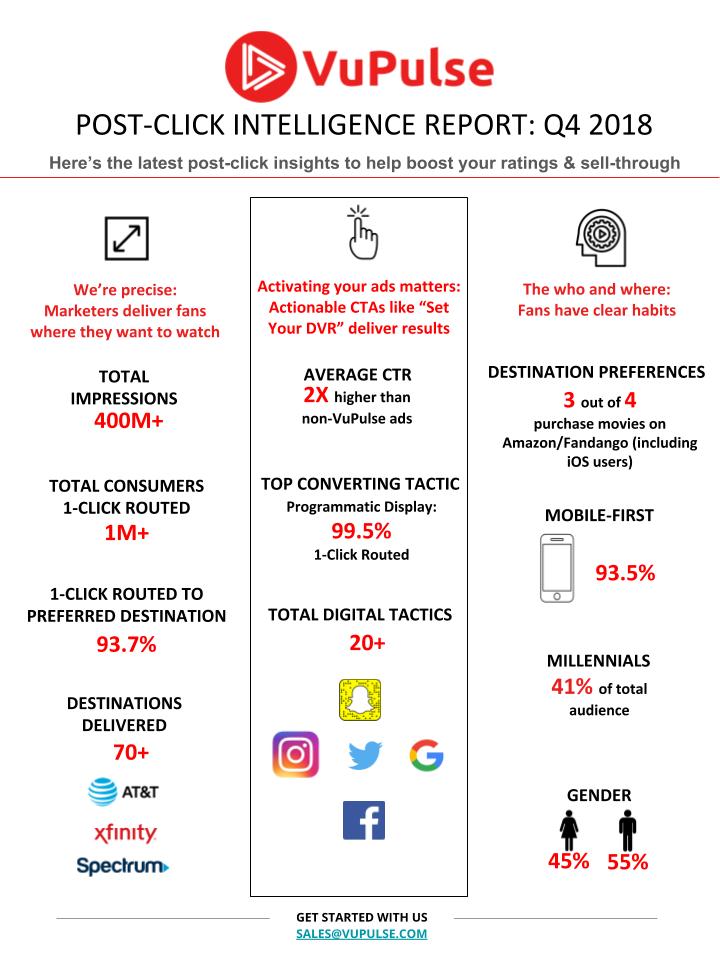
Given all of that background, we’ve gone through our CDP to put together the highlights of Q4 for you.
A few key takeaways include:
- 93%+ of consumers were sent to their preferred viewing or buying destination in one click
- 75% of consumers purchased digital home videos on Amazon/Fandango, regardless of OS
- Consumers selected over 70 different distribution platforms, reinforcing the need for technology to streamline the fragmented ecosystem
Check out the full report below or click here to grab it.


